Music Graph Project: Interactive Expand/Collapse
Phase 1 is now complete. I learned alot during this session with Claude. I have almost zero experience with Javascript. I had Claude break down each function and help me mind map it back Python. Below is the post about our seesion in Claude’s word with minor edits by me.
Implemented the expand/collapse functionality today. Genres can now be clicked to show or hide their bands, keeping the graph clean and focused.
The Goal
My son Aidan’s original vision: genres visible by default, bands hidden. Click a genre to expand it and see its bands. Click again to collapse. This keeps the graph manageable as the dataset grows.
Implementation Approach
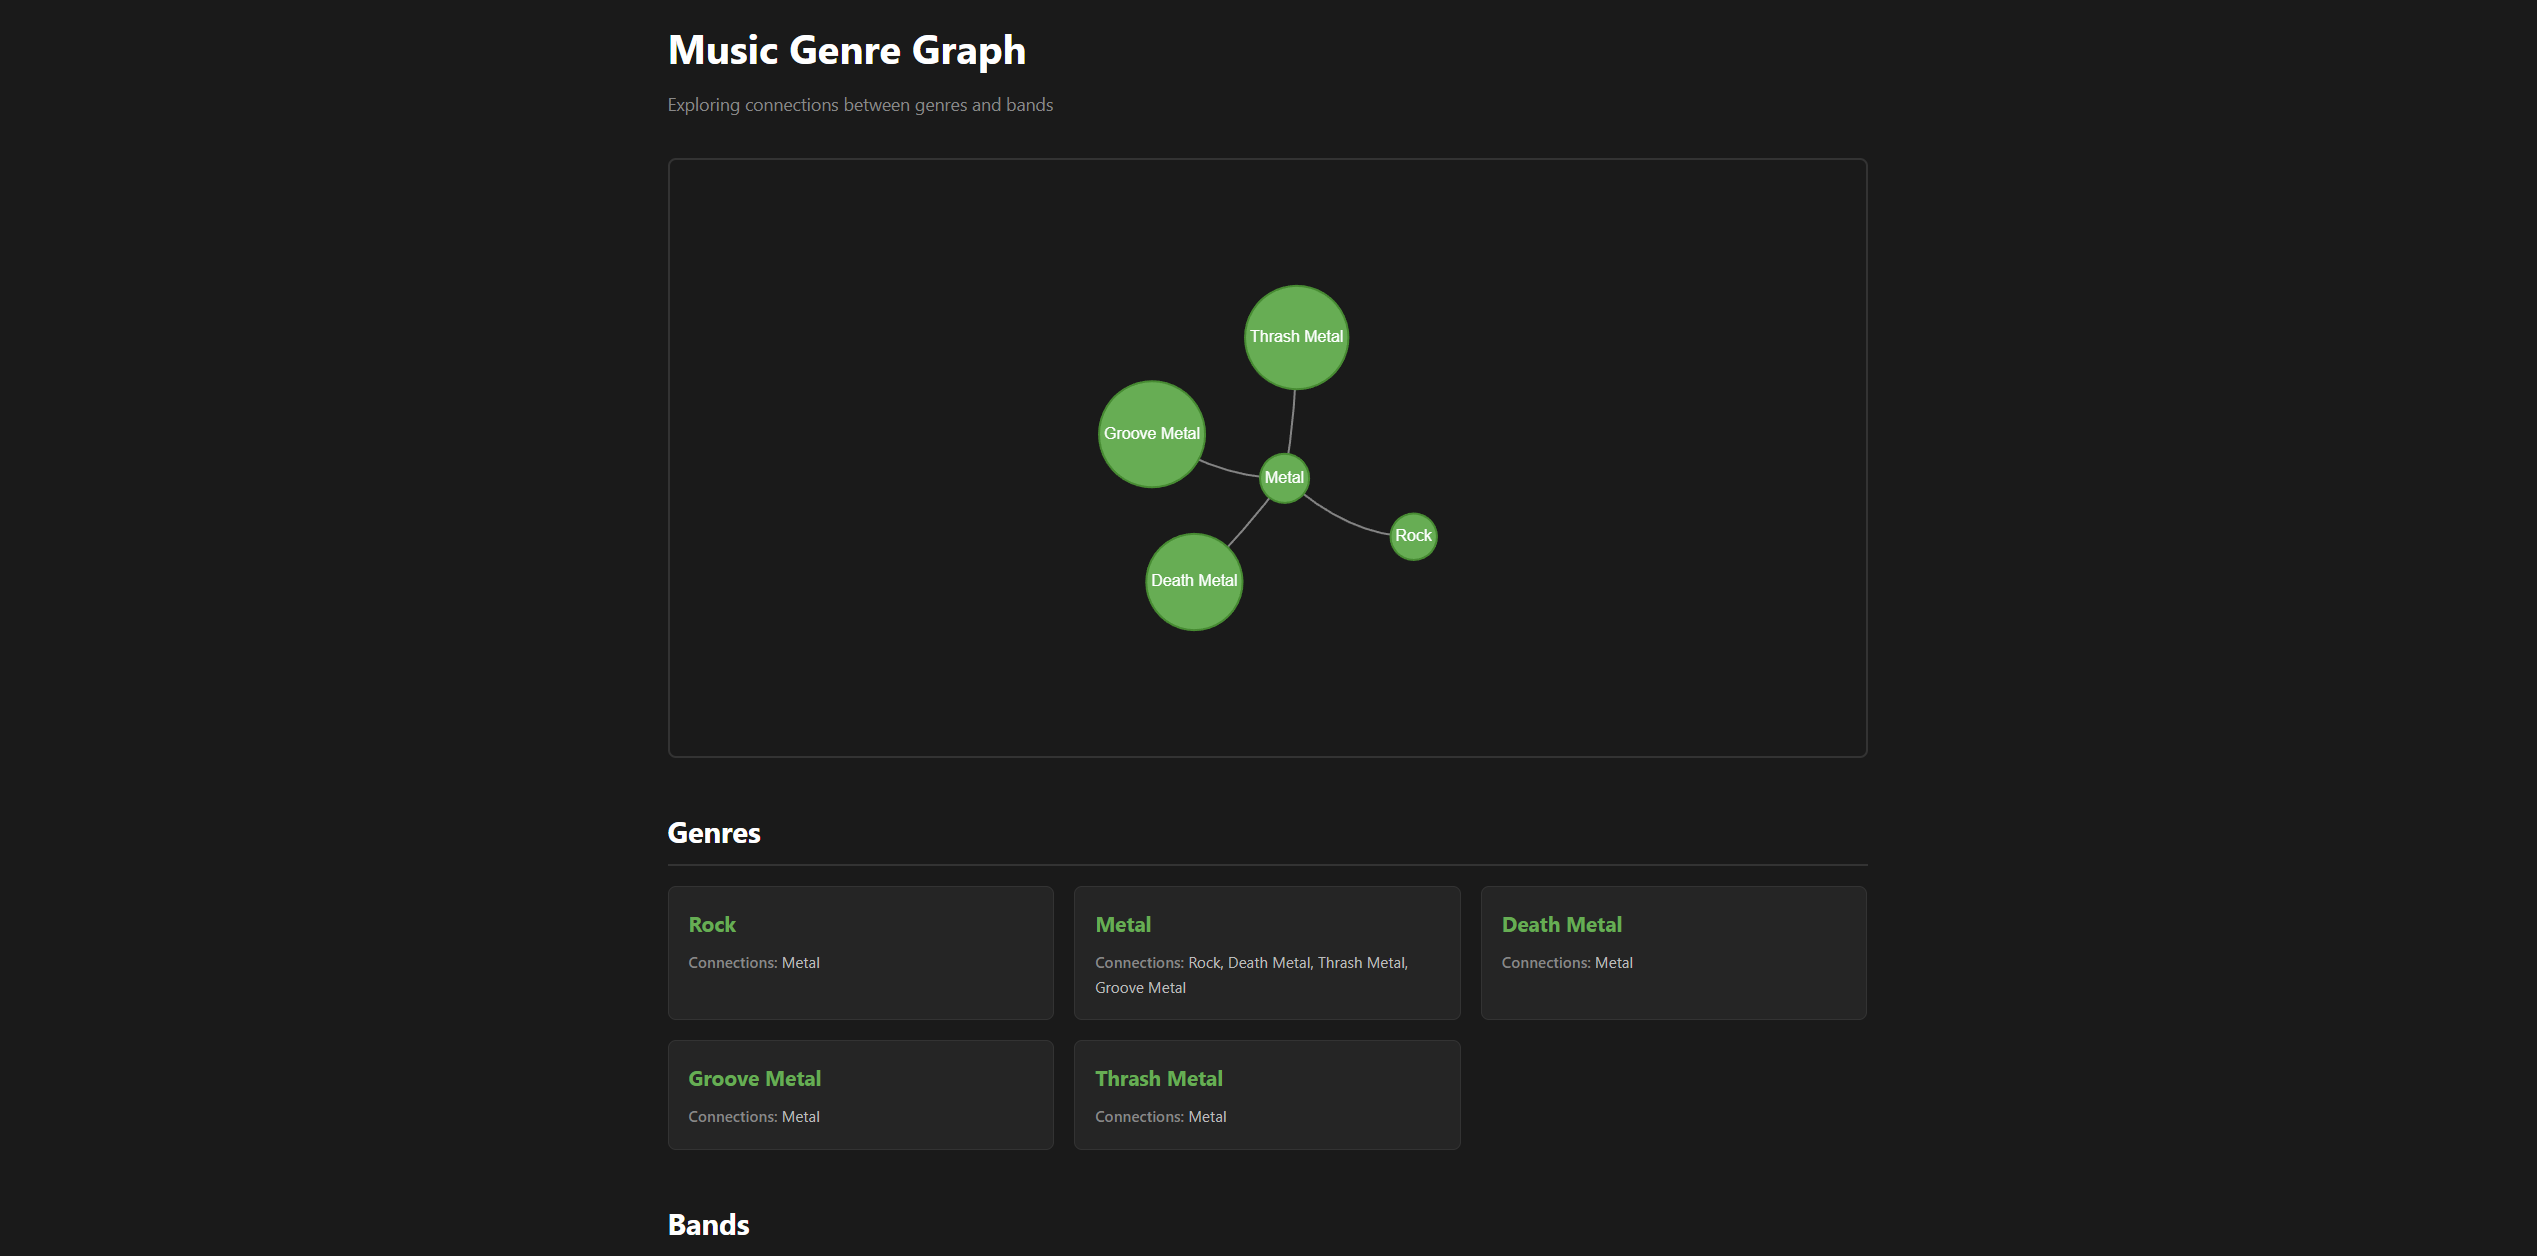
Default state: All bands have hidden: true when the graph loads. Only genre nodes are visible.
Tracking state: A JavaScript Set tracks which genres are currently expanded:
var expandedGenres = new Set();
Click handler: Vis.js provides event listeners for graph interactions:
network.on("click", function(params) {
    if (params.nodes.length > 0) {
        var clickedNodeId = params.nodes[0];
        var clickedNode = nodes.get(clickedNodeId);

        if (clickedNode.group === 'genre') {
            toggleGenre(clickedNodeId);
        }
    }
});
Toggle logic: Check if the genre is already expanded, then show or hide its bands:
function toggleGenre(genreId) {
    if (expandedGenres.has(genreId)) {
        expandedGenres.delete(genreId);
        hideBandsForGenre(genreId);
    } else {
        expandedGenres.add(genreId);
        showBandsForGenre(genreId);
    }
}
Show/hide bands: Loop through all nodes, find bands belonging to the clicked genre, and update their visibility:
function showBandsForGenre(genreId) {
    nodes.forEach(function(node) {
        if (node.group === 'band' && node.parentGenre === genreId) {
            nodes.update({id: node.id, hidden: false});
        }
    });
}
Learning JavaScript
This was my first real JavaScript implementation beyond basic syntax. Coming from Python and Bash, the concepts translated well:
- Sets work the same (add, check membership, delete)
- For loops are just different syntax (
forEachvsfor...in) - Event listeners are callbacks (like signal handlers in Bash)
- Anonymous functions took some getting used to
The mental model helped: this is state management - track what’s open, update UI when state changes. Same concepts as any scripting language, just different syntax.
Current State
The graph now:
- Shows genres by default (clean view)
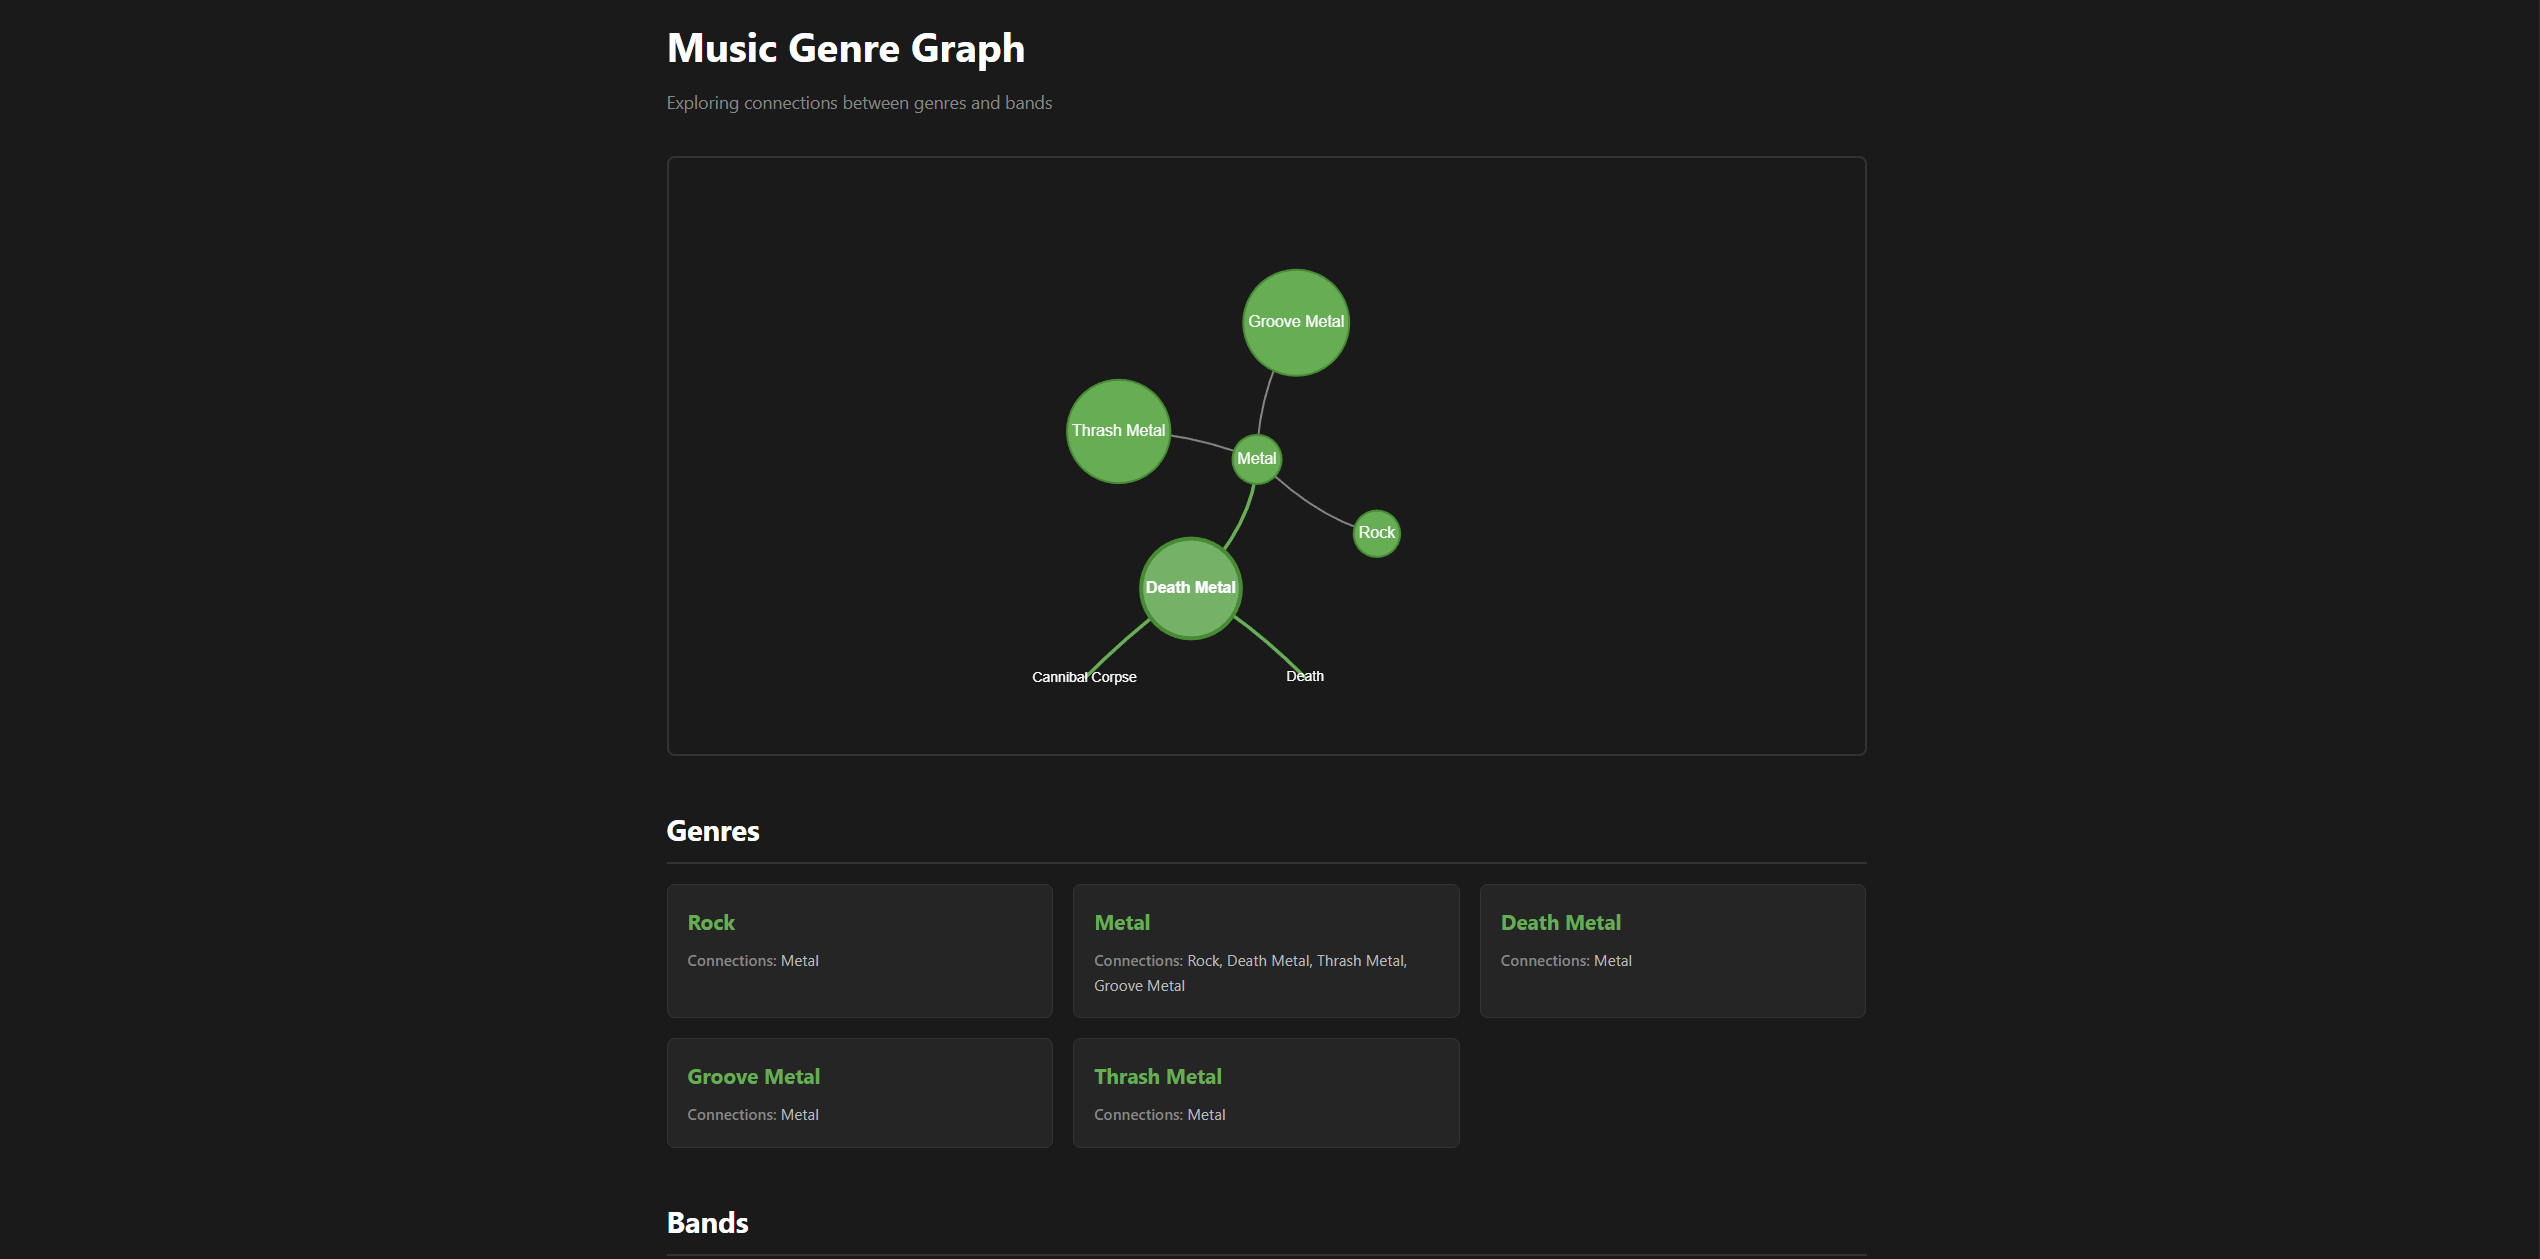
- Expands to show bands when clicked
- Collapses to hide bands when clicked again
- Multiple genres can be expanded simultaneously
- Physics engine adjusts layout as nodes appear/disappear
Screenshots
Phase 1 Complete
This completes Phase 1 of the project:
- ✅ Flask application with data structures
- ✅ Graph visualization with Vis.js
- ✅ Genres and bands displayed appropriately
- ✅ Interactive expand/collapse functionality
The proof of concept works. The foundation is solid.
What’s Next: Phase 2
Moving from dictionaries to a proper database:
- Design schema for genres, bands, relationships
- Set up SQLite (easy local development)
- Migrate data from Python dicts to database
- Update Flask routes to query database instead of hardcoded data
This will enable:
- Easier data management
- Adding/editing without touching code
- Eventually, user contributions
- Better handling of the genre hierarchy issue we documented
Code
This release is tagged as v0.0.4-alpha.
This is part of the Music Genre Graph project series. See the project introduction for the full roadmap.